
Can You Build Dashboards in Project Insight?
Yes, Project Insight lets you build dashboards that bring reports, charts, and web pages together on one screen. A dashboard is essentially a collection of report tiles and chart tiles arranged in a layout that helps users review project, department, task, resource, portfolio, or executive reporting information in one place.
Dashboards are useful when you want to give users a focused view of related information without requiring them to open each report separately.
Best For
This article is best for:
- Project managers
- PMO leaders
- Department leaders
- Executives
- Administrators
- Reporting users
- Teams that need one shared view of multiple reports or charts
How Do You Open Dashboards?
To open dashboards:
- Open the Main Menu in the top left.
- Select Dashboard.
- Click Dashboard to start building your first. **If dashboards have already been saved or shared with you, their names appear in the fly-out menu. Click a dashboard name to open it.
If you do not already have a dashboard built, click Dashboard to start building your first one.
What Is a Dashboard in Project Insight?
A dashboard is a collection of reports, charts, and optional web pages displayed together in tiles on one screen.
For example, a department dashboard might include:
- Project reports
- Task reports
- Resource reports
- Charts
- Gantt-style views
- Lists of current and overdue work
- Web page links or embedded pages
This gives users a single place to review the reporting information that matters most to them.
How Do Dashboard Tiles Work?
Dashboard content appears in tiles. Each tile can contain a report, chart, or web page.
You can expand tiles, adjust tile layout, and change tile settings depending on the type of information you want to show.
This is helpful when one report needs more space, while another report or chart can fit in a smaller section of the dashboard.
How Do You Change the Dashboard Layout?
To change the dashboard layout:
- Open the dashboard.
- Click Dashboard Options in the top right.
- Choose the layout option you want.
Dashboard layout options control how tiles are arranged. For example, you may choose different column layouts depending on whether you want one large report at the top, multiple columns in the middle, or a more compact chart layout.
The best layout depends on the types of reports and charts you are displaying.
What Can You Add to a Dashboard?
Depending on your setup, you can add:
- Out-of-the-box charts
- Saved reports
- Shared reports
- Chart-only reports
- Web pages
Project Insight supports up to eight saved reports on a dashboard and up to eight web pages.
Saved reports can include reports you created or reports that have been shared with you.
How Do You Add a Report to a Dashboard?
To add a report tile:
- Open the dashboard.
- Go to the dashboard reporting options.
- Choose a report tile number.
- Select the saved report you want to add.
- Confirm or adjust the report settings.
The available report list includes saved reports in your workspace, including reports you saved and reports shared with you by someone else.
Can You Add Charts to a Dashboard?
Yes. Dashboards can include charting options and chart-only reports.
Charts are helpful when you want a more visual dashboard for leaders, departments, or PMO reporting.
Can You Add Web Pages to a Dashboard?
Yes. Dashboards can include web page tiles.
A web page tile can use a link from a website and display it as part of the dashboard view. This can be helpful when teams want to include outside reference pages, internal resources, or related web-based information alongside Project Insight reports.
How Do You Adjust Report Tile Height?
Each tile has its own gear or settings option.
To adjust tile height:
- Open the dashboard.
- Find the tile you want to adjust.
- Click the tile’s gear/settings icon.
- Change the report height value.
Report height is set in pixels. For example, a shorter report may work well at 300 pixels, while a larger report may need 500 pixels or more to give users enough room to review and expand results.
You may need to test different heights to get the dashboard layout exactly how you want it.
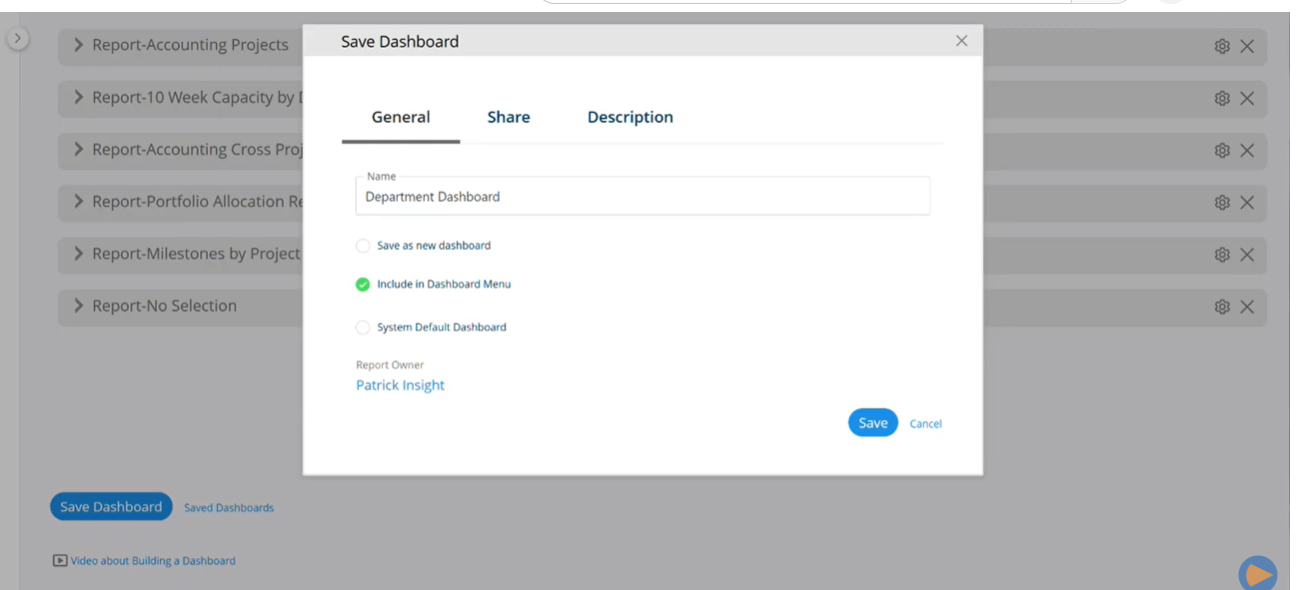
How Do You Save a Dashboard?
After adding reports, charts, web pages, or layout changes, save the dashboard.
To save:
- Click Save Dashboard.
- Choose whether to save as a new dashboard or update the existing dashboard.
- Choose whether to include the dashboard in the dashboard menu.
- Choose whether to make it the system default dashboard, if needed.
- Save your changes.
 What Does Save as New Dashboard Mean?
Save as New Dashboard creates a separate new dashboard.
Use this when you do not want to overwrite the dashboard you are currently viewing.
If you leave Save as New Dashboard unchecked, you may update or overwrite the existing dashboard.
What Does Include in Dashboard Menu Mean?
Include in Dashboard Menu makes the dashboard appear in the dashboard fly-out menu.
This is useful when you want users to quickly access the dashboard from the main Dashboard menu.
What Does System Default Dashboard Mean?
System Default Dashboard makes that dashboard the default dashboard users see when they open Dashboard Home.
Use this carefully, especially if the dashboard is intended for a broader audience.
Can You Share Dashboards?
Yes. Dashboards can be shared with:
- Users
- Departments
- Companies
- Groups
This works similarly to sharing reports. When you save and share a dashboard with the right audience, those users can see the dashboard from the dashboard fly-out menu.
Sharing options may depend on your workspace settings and enabled add-ons.
When Should You Use a Dashboard?
Use a dashboard when you want to:
- Show multiple reports in one place
- Create an executive reporting view
- Build a department-level reporting page
- Combine charts and lists for easier review
- Share a standard reporting view with a team
- Monitor portfolio, project, task, or resource information
- Give users one place to review key reporting data
Dashboards are especially helpful when users need quick visibility without opening several separate reports.
Common Mistakes When Building Dashboards
Forgetting to save changes
Dashboard changes need to be saved. If you adjust reports, charts, layout, or tile height, click Save Dashboard.
Overwriting an existing dashboard by accident
Use Save as New Dashboard if you want to create a separate dashboard instead of updating the current one.
Not including the dashboard in the menu
If users need quick access from the dashboard fly-out menu, make sure Include in Dashboard Menu is selected.
Making the wrong dashboard the system default
Only select System Default Dashboard when that dashboard should be the default view when Dashboard Home opens.
Not adjusting tile height
Some reports need more room. Use the tile settings to adjust report height so users can review the dashboard more easily.
Related Questions
Can I add reports shared with me to a dashboard?
Yes. The available report list can include reports you saved and reports shared with you.
Can dashboards include charts?
Yes. Dashboards can include charting options and chart-only reports.
Can dashboards include web pages?
Yes. You can include web page tiles using links from websites.
How many reports can I include on a dashboard?
You can include up to eight reports on one dashboard.
How many web pages can I include on a dashboard?
You can include up to eight web pages on one dashboard.
Can I share a dashboard with a department or group?
Yes, dashboards can be shared with users, departments, companies, or groups when the relevant options are available.
In Short
Dashboards in Project Insight let you bring reports, charts, and web pages together on one screen. You can choose the dashboard layout, add saved or shared reports, adjust tile height, save the dashboard, include it in the dashboard menu, set it as the system default, and share it with the right users, departments, companies, or groups.
Comments
0 comments
Please sign in to leave a comment.